Product Recommendations Using HRNN
1 April 2020
Factors to keep in mind while Forecasting
14 April 2020

Published by
BluePi
Data-Driven Business Transformation
What are the confidence intervals?
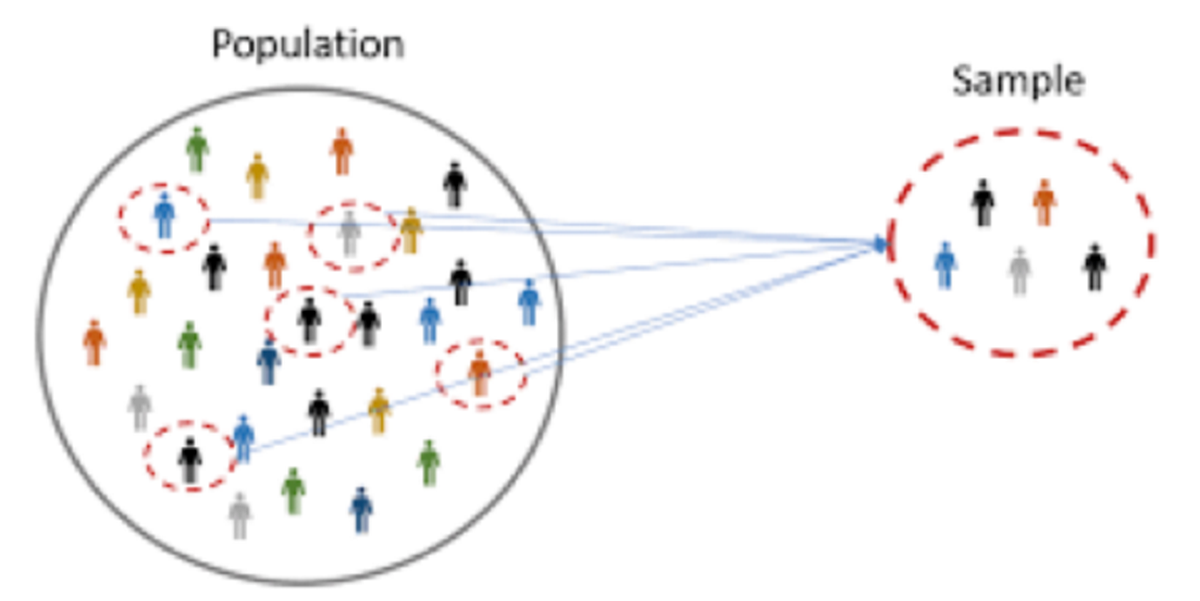
In statistics, it is almost always impossible to deal with the entire population as a whole. When I say population, I mean considering each and every possible value of a variable under consideration – be it sales of a commodity or the number of customers that visit an e-commerce website. Most of the time, a sample of the entire population is considered to analyse the data, forecast future value and even make decisions to run a business. Sampling is also more practical than using an entire population since it makes computation and model training faster, gives higher quality measurements and is definitely less expensive

Using samples however leads to some inherent uncertainty that creeps into the estimates – be it the average of sales, its variance or even its future forecast. Confidence intervals provide a way to overcome this uncertainty by providing us with a range of values of the said estimate rather than just a single value.
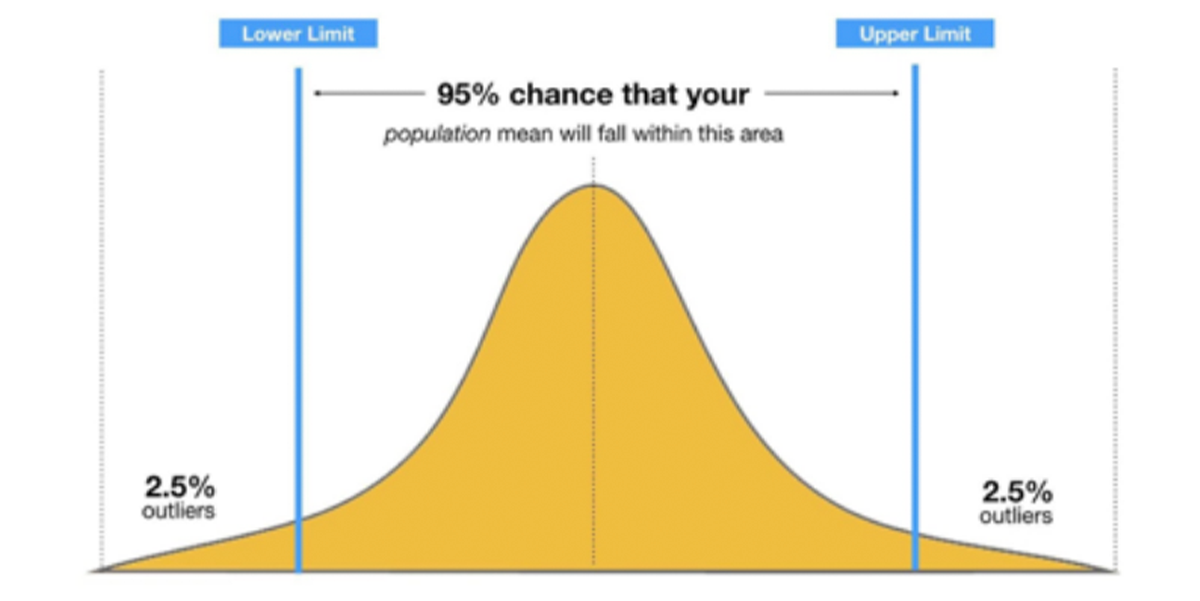
If you google confidence interval, this is the very first image that pops up

We can see that any confidence interval is characterized by an upper limit, a lower limit and a percentage value which is the level of confidence (alpha) that one desires in the estimates. The most commonly used alpha value is the 95% interval with the 90% and the 99% intervals following up next based on the user’s need.
Interpretation
There are several ways to derive confidence intervals, most commonly used are –
Deriving confidence intervals
What does one mean when they say that there is a 95% confidence that a value will lie between a said upper and a lower limit?
Consider an example. Suppose we are trying to predict the sale of a particular SKU (Stock keeping unit) at a particular store for the coming fortnight. It is expected that 15 pieces of the SKU will sell – either predicted by a machine learning model or by the simple technique of years of experience. In an ideal world, this would be the perfect solution, 15 SKUs would sell, the `store will not have any excess inventory nor it will be short on stock. In real life however, stores like to be prepared to not lose a sales opportunity and hoard much more than what is expected to sell. This is known as a safety stock.
Most machine learning models provide a point estimate, but if somehow a range of values could be obtained with a certain probability associated to it, the store managers could decide a better estimate of the products that would sell and thus stock appropriately without causing the problem of over-stocking. If I say that 15 items would sell the next fortnight along with the information that with 95% certainty 13 – 17 items would sell, the store can have a safety net of the 2 extra items in case the prediction of 15 deems inaccurate (Here only the case of the upper limit is taken into account considering the fact the risk of the loss of 2 sale is more than the extra-cost of over-stocking).
Statistically speaking a 95% confidence interval implies that if similar conditions are replicated 100 times, 95 times the value of the estimate (forecast, mean etc.) will lie in this interval of values. Clearly this 95% can change to 99% which will give us a wider range of values, but more surety of the location of the estimate and similarly a 90% interval will give a smaller range of values but a less sure location of the estimate and so on.
- Summary Statistics - In this way the mean of the sample is calculated along with the standard deviation and an integer is multiplied with it. This quantity is then added and subtracted from the mean to provide the interval.
- Hypothesis Testing - Considering the confidence region $ \alpha $, a confidence interval can be created using that region where the given value is in fact the true value is not rejected or the significant region of the null hypothesis.
$ CI=Mean(k∗StandardDeviation) $
Commonly known as ‘predictive confidence intervals’ if we know the underlying distribution of the sample, we can obtain the interval [lower limit, upper limit] such that the new observation Yn+1 lies within this range with some confidence level. The NGBoost algorithm provides a way to estimate the parameters of each forecast corresponding to every observation using maximum log – likelihood and continuous probability rank score (CPRS) to do so. It has 2 components –
- The underlying distribution that the user wants to consider based on the problem statement (Normal, log normal, exponential etc.)
- The base learner - mostly a decision tree
Once the parameters of a distribution are estimated against each forecast, we can easily use the interval function in python to obtain the upper and lower bounds with specification of the percentage level of confidence we need.
Mathematically l and u are derived using,
$ \alpha =P ( l < Y < u) $ ,
where
$ \alpha $ is the level of confidence that we require,
l is the lower bound
u is the upper bound
P ( ) is the probability function of the distribution under consideration
An example is given below in a clipette.

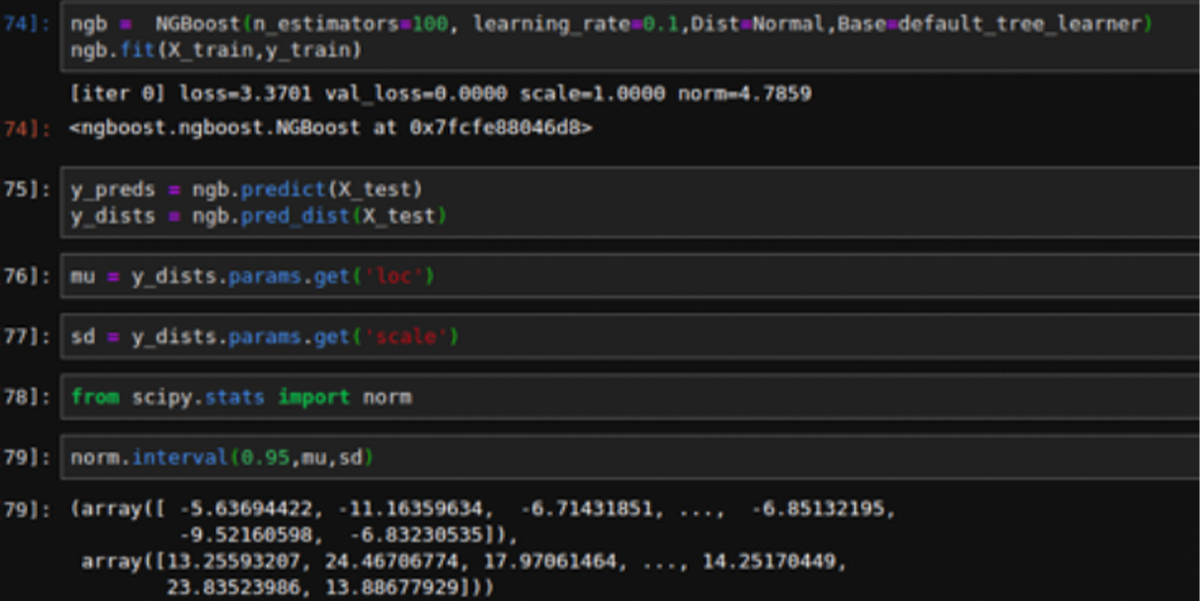
A NGBoost model was applied to a sample data with Normal distribution and default tree learner set as the base learner for the algorithm. The model predictions were stored in the y_preds variable along with the distribution parameters in y_dists. The location parameter (mu) and the scale parameter (standard deviation) were then extracted from the obtained dictionary and using the ‘interval’ method from scipy.stats in python for normal distribution we obtained the 95% confidence intervals.

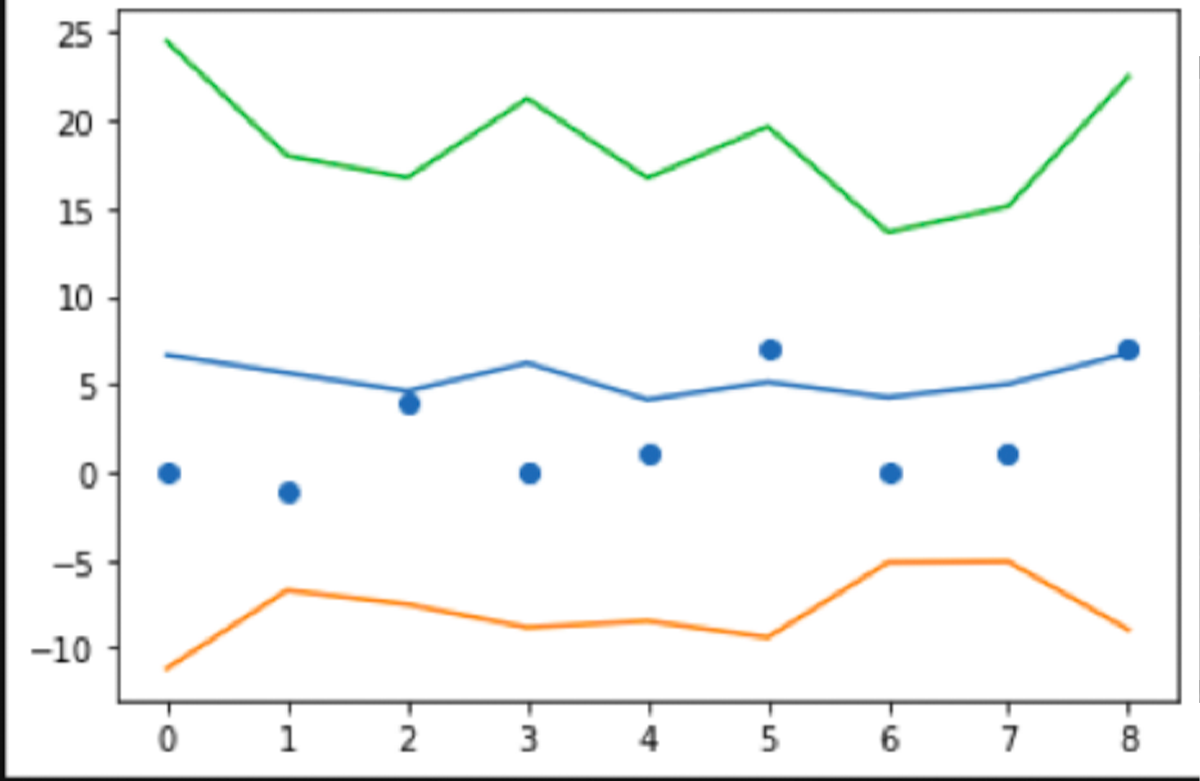
Here is a representation -
The plotted points are the observed values, the blue line gives the prediction points, the green line represents the upper bound and the orange line represents the lower bound. In conclusion, confidence intervals can be effectively used to model the uncertainties and thus work much better than point estimates when it comes to real life problems.
About the Author

Published by
BluePi
Data-Driven Business Transformation

Published by
Sidhant Arora
Marketing Manager
With 8+ years of brand and marketing expertise, Sidhant has empowered 50+ businesses across industries. His passion lies in crafting impactful 360° strategies that seamlessly blend storytelling and targeted campaigns, guided by data-driven insights. He sculpts compelling narratives that resonate with target audience crafting focused campaigns to expand brand presence across digital, offline, and PR channels to unlock their full potential.


